Please note that this page lists a brief summary of the actual work done throughout this project. The complete project report can be downloaded by clicking the download button below.
The effectiveness of a wing is most often expressed in its lift-to-drag ratio which on a high level describes the wing’s efficiency of translating thrust into lift. A high ratio of lift to drag would suggest that only a small amount of thrust is necessary for the wing to generate enough lift for it to be propelled through the air. Conversely, a low ratio of lift to drag would suggest that a significant amount of thrust is necessary for the wing to generate enough lift to be propelled through the air. In this project, we are interested in selecting a high-performing wing for a new unmanned aerial vehicle considering its effectiveness, stall angle behavior, and overall dimensions to arrive at an ideal geometry. Through research, we identified two wings of interest that may satisfy our requirements, the FX63-137 and the LRN1015. These wings were first evaluated in 2D simulations where their performance metrics were subsequently determined using the Computational Fluid Dynamics (CFD) data. The better-performing wing was used to create a 3D wing and CFD form. The results of this investigation and the final determination for the most appropriate wing are described in terms of ratios of combined metrics.
Computational fluid dynamics (CFD) was used to determine the aerodynamic metrics of the two airfoil profiles under consideration. Two-dimensional (2D) CFD models for both the FX63-137 and the LRN-1015 airfoils were performed. Once the metrics were obtained from the 2D CFD simulations the airfoil with the larger performance metric was selected to be tested in the wind tunnel. Furthermore, a 3D CFD simulation of this airfoil was also created. In general, CFD is subdivided into three sections. The first section deals with constructing the mesh and is called preprocessing. The second section deals with running the simulation, and the last section deals with the results and is usually called postprocessing. To create the mesh for a CFD simulation two general steps must be taken. First, a domain size analysis must be conducted to make sure that the boundary conditions aren’t influencing the results. Once the domain size is identified then a mesh refinement analysis must be performed. To perform the domain size analysis five domains with different sizes were selected. To make sure that domain size is the only parameter that could influence the results, the mesh resolution for all domains was kept constant. CFD simulations were conducted for each case and the 𝐶𝑙 and
𝐶𝑑 values were collected. These values were then plotted as a function of domain sizes. One could argue that as the 𝐶𝑙 and 𝐶𝑑 values approached a constant number asymptotically the domain influence on the results would be decreasing to a negligible value. Note that the 𝐶𝑙 and 𝐶𝑑 values obtained during the domain size tests are not the correct values. They are just numerical values that are being tracked during the test. To obtain the correct lift and drag coefficient one must perform a mesh refinement analysis and model the boundary layer profiles too. The mesh refinement analysis follows the same process as that of domain size analysis. Instead of changing the domain size, the element size is reduced. Seven different mesh resolutions are tested for each case and the 𝐶𝑙 and 𝐶𝑑 values are tracked and plotted as a function of mesh elements. Note that as 𝐶𝑙 and 𝐶𝑑 values approach a constant value asymptotically the mesh resolution impact on the results becomes negligible. Wall functions were used to model the boundary layer for all CFD simulations. To calculate the 𝑌+ value, flat plate approximations were used to model the boundary layer near the airfoil. By definition 𝑌+ has the following equation:
𝑌+ =𝑈𝜏∆𝑦𝜌∞/𝜇∞
Where 𝜌∞ and 𝜇∞ are the freestream density and dynamic viscosity respectively and ∆𝑦 is the first layer cell height. Note that the friction velocity can be defined as:
𝑈𝜏 = √𝜏𝑤/𝜌∞
The wall shear stress term was modeled using the following equation:
𝜏𝑤 = 0.5𝐶𝑓𝜌∞𝑢∞2
Where 𝑢∞ is the freestream velocity and 𝐶𝑓 is the skin friction which is modeled using the following equation:
𝐶𝑓 = 0.074/𝑅𝑒^(1/5)
A unit chord length was used to perform the CFD at Reynold’s number of 10^5. Therefore, the velocity value was adjusted from 18.2𝑚/s to 1.4710 𝑚/s to keep Reynold’s number fixed at 10^5.
Finally, 𝑘 − 𝜀 model was used to model the mean flow characteristics of the steady-state turbulent flow. The k−𝜀 model is a two-equation model that gives a general description of turbulence using two transport equations. One for the turbulent kinetic energy 𝑘 and the second for the turbulent dissipation 𝜀. The derivation of these equations is beyond the scope of this report, but the one-dimensional versions of these equations are shown below as an example.
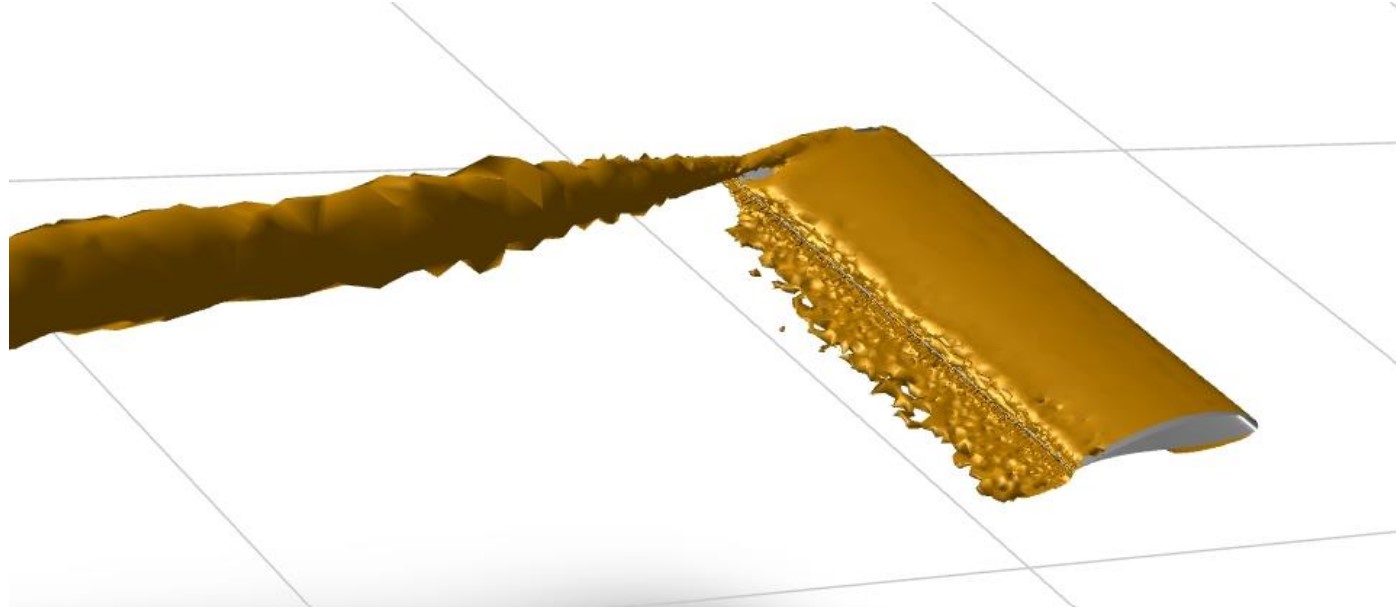
The airfoils selected were modeled in SolidWorks. Each wing was modeled in sections so that they would meet the dimensional constraints of the 3D printer. The printer used for the project was the Prusa i3 MK3s. After the wings were printed, it was noted that the trailing edge did not print correctly on both wings. To repair the wings and ensure that these flaws did not impact the test results, J-B Weld epoxy was used to repair the trailing edge of the wings, as shown in Figure 1.
Once the epoxy had set, the trailing edge was sanded down to its approximate airfoil shape. After the sanding was complete the two halves of the wing were glued together using super glue. Lastly, to maximize the experimental results, the 3D-printed wings were wrapped with polypropylene tape, more commonly known as “Tuck Tape”, as shown in Figure 2. The Tuck Tape was used to create a smoother surface in order to reduce skin friction drag compared to the unfinished 3D-printed wing.
Something to note was that given the geometry of the elliptical wing, it proved difficult to prevent the tape from wrinkling and creasing, especially around the rounded ends. However, the creases that were made were directed so that they were in line with the flow direction so as to minimize their effects on the flow. In this manner, it is expected that the creases would have negligible effects on the results.
The wind tunnel testing is mostly done automatically, with the user only needing to complete setup tasks at first. In order to start collecting data, the power supply to the wind tunnel must be on and allow some time for the sensor to warm up in order to reduce error and increase the measurement accuracy. Once the sensor has had time to warm up, the airfoil is installed onto the force transducer at the quarter chord location (𝑐/4) of the airfoil which is defined as the aerodynamic center. After installation, ensure that the airfoil is tightly attached to the force transducer and launch the Arduino IDE and serial monitor by clicking the magnifying glass symbol at the top right of the Arduino window. As well as launching the serial monitor, be sure to launch the sensor program and click log data in the top left of the window once ready to start logging data points. Before the test can run, it is important to home the airfoil by sending ‘h’ into the Arduino serial monitor and setting the airfoil AoA to 0° by selecting ‘Bias’ in the sensor program. Once set, the wind tunnel can be turned on and left for a few minutes to reach a freestream speed of 18.2𝑚/𝑠. After a few minutes, send ‘r’ into the serial monitor and then “Collect Streaming” on the pop-up prompt. The remainder of the wind tunnel testing is completed automatically using the Arduino IDE and sensor application, and data will automatically be written into a .csv file and saved to the specified location. Once the angle of attack sweep has fully completed, ramp down the wind tunnel and then click “Stop Collecting” to complete the wind tunnel test. This process will automatically record data for varying angles of attack specified by the user at an interval of 2° per step while recording data for 20𝑠 at each interval.


To reduce the work needed for creating this website I have decided to end the page here. However, all the details and the results on the performance of the two wings and the construction of the meshes are provided in the full report. The full report can be downloaded from the link at the top of this page.